Introduction to the Debugger
Eclipse lets you stop the execution of your code and look at what’s going on via its debug facility. Here’s how to get started with it.

The first thing we’ll do is set a breakpoint–a place where the JVM will pause execution. Double-click in the blue margin to the left of line 23, and a blue circle appears there, indicating a breakpoint is set. If you right-click on the circle or in the margin, the Breakpoints view shows you a number of options regarding what you can do with the breakpoint, such as:
- Toggle breakpoint (remove or establish a breakpoint)
- Disable or enable an existing breakpoint (disabling means that the breakpoint remains but execution will not pause there until the breakpoint is reenabled)
- Establish a tracepoint–a breakpoint where execution pauses only if a condition specified in the breakpoint properties is true when the breakpoint is reached
Breakpoints and tracepoints are set on executable code. There’s a third means of pausing execution: a watchpoint. Like breakpoints, you set them by double-clicking in the left margin, but on a variable declaration instead of executable code. When a watchpoint is set, execution pauses whenever the variable declared on the line is referenced or modified; you can change this behavior in the watchpoint properties in the Breakpoints view.
Let’s debug
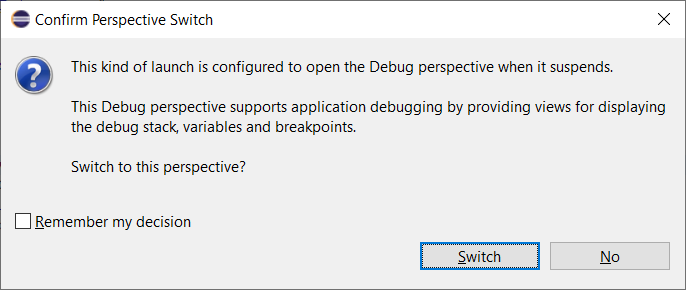
Start the program as before, but instead of selecting Run as Java Application, choose Debug…. Since this is your first time debugging, this window pops up:

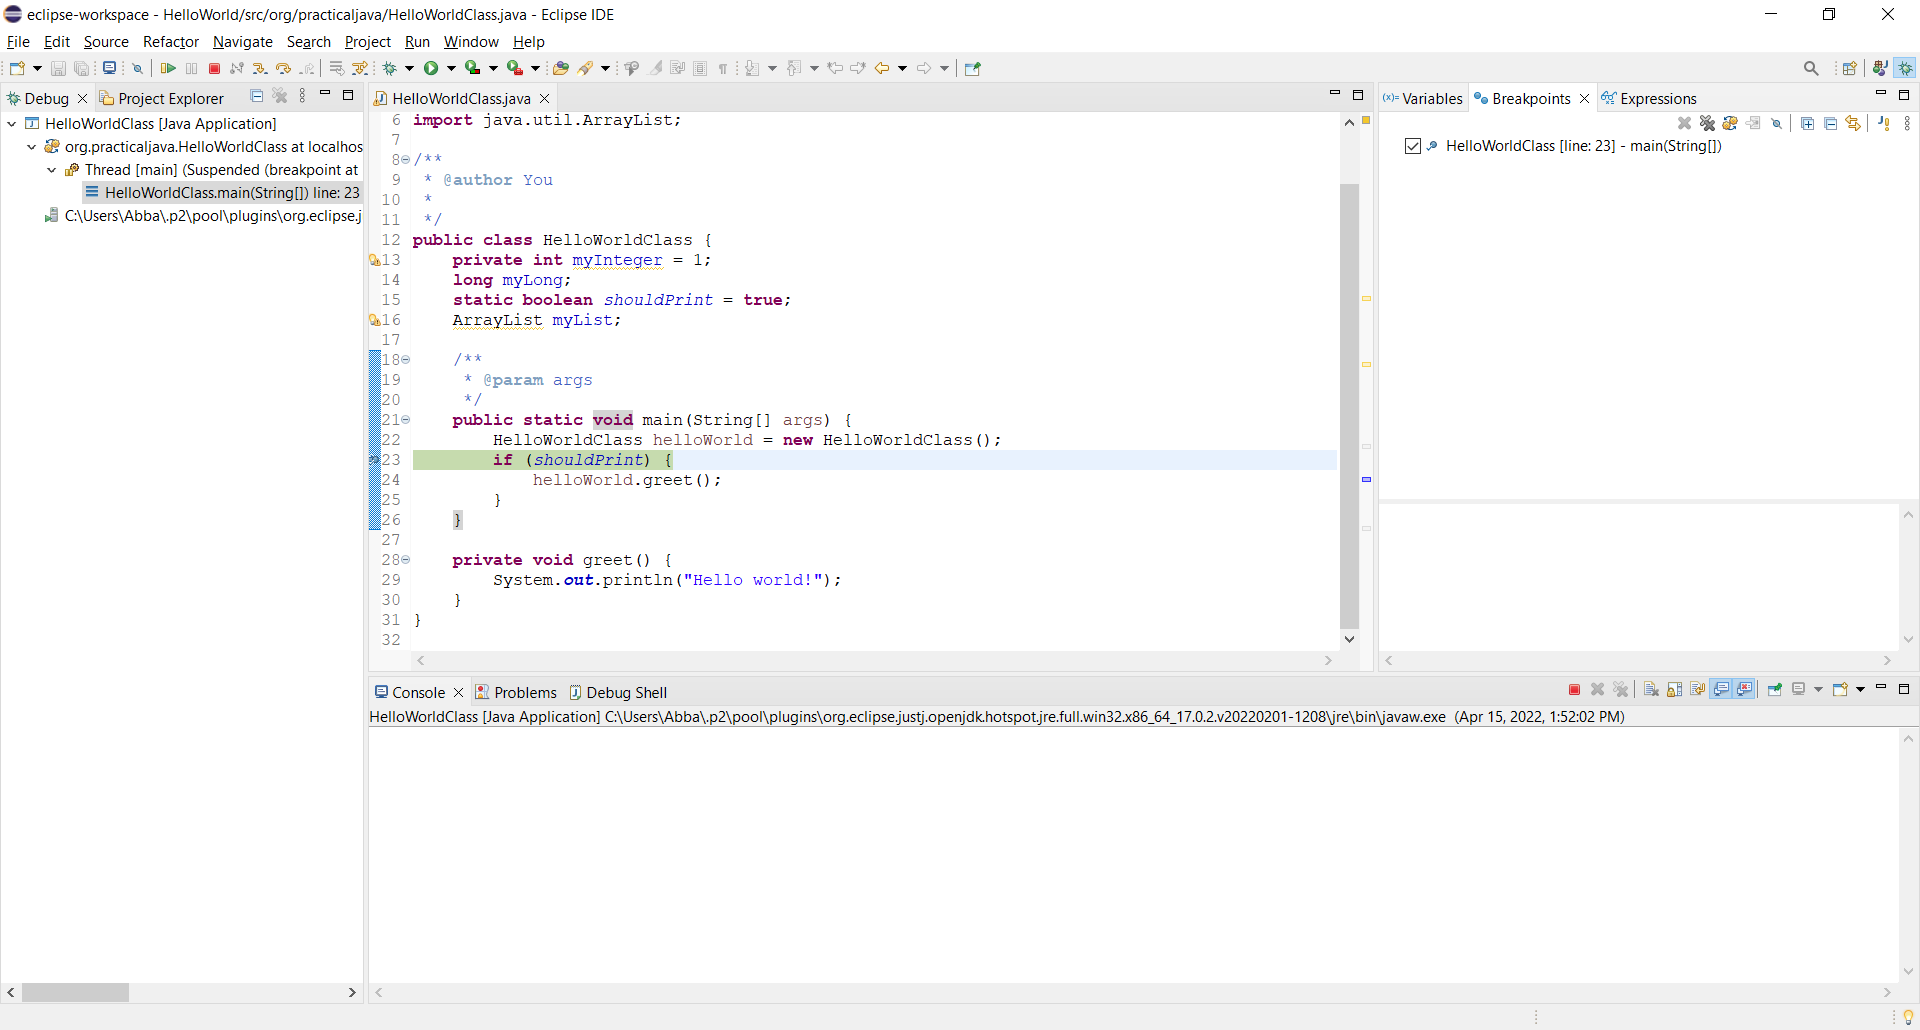
Personally, I’ve never wanted not to switch to the Debug perspective, so I check the “Remember my decision” box. In any case, click the Switch button and this is the result:

There’s a lot going on there, so let’s check it out.
On the left is the Debug view which shows a hierarchy of where you are in your program.
In the middle is an editor view. Note the line highlighted in green; this is where your program is paused.
On the right is the Breakpoints view, which shows the breakpoints that are currently set and from which you can modify their properties by right-clicking and selecting from the popup menu. We invite you to investigate the options available in the breakpoint properties window.
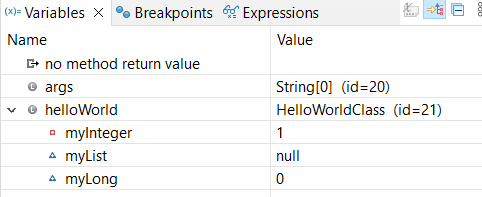
Click on the Variables tab to show the Variables view, which shows the variables declared in the main() method and their values.

helloWorld holds an instance of the HelloWorldClass class. We’ve expanded the node so you can see its fields with their current values. You can right-click on a line here and change the value of you wish.
Viewing variables
With execution paused, mouse over the declaration of shouldPrint or the reference to it in line 23. You’ll see a window pop up showing the variable’s current value. The window will disappear if you move your mouse away, but if you click within it, the window persists until you click outside it. You can do the same by right-clicking on the name and selecting Inspect from the popup menu.
One of the most useful options in the popup menu that appears when you right-click on a variable name is Watch. Try it! Select the name shouldPrint, right-click on the selected text, and click on Watch. The Expressions view comes in front of the tabs on the right and looks like this:

Stepping through execution
Now let’s move through our code one statement at a time. Once execution pauses at a breakpoint, you can control its progress by pressing function keys (or selecting the equivalent operations from the Run menu, but why?):
| Function Key | Result |
| F5 | Execute the next line of code. If it calls a method, pause at the first line of that method. |
| F6 | Execute the next line of code. If it calls a method, execute the method and pause at the line following the method call. |
| F7 | When within a method, pause at the line following the method call. |
| F8 | Resume execution and don’t pause until an active breakpoint is reached. |
Try it! Press F5. Since there’s no method call on line 23, execution pauses at line 24–F5 behaves the same as F6.
Press F5 again and execution pauses at line 29, the first line in the greet() method. If you press F6, execution pauses on line 30: the closing brace, which is essentially the return point from the method. If you press F7, execution leaves the greet() method and pauses at line 26, which is the return point from main().
And now we’ll press F8. Since there are no more breakpoints, the program runs to completion. Congratulations!
Conditional breakpoints
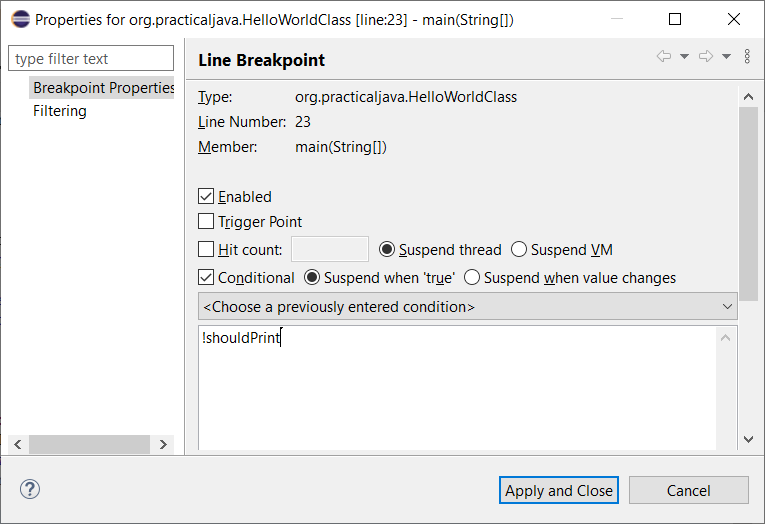
As mentioned above, breakpoints can be set to pause only on certain conditions. Let’s try this. In the Breakpoints view, right-click on our line 23 breakpoint and choose Breakpoint properties from the popup menu. The window below will appear. Check the Conditional box and type “!shouldPrint” in the box below, like this:

“!shouldPrint” is a conditional expression that means “shouldPrint is not true”, which we know is not the case.
Press Ctrl-S to save the configuration. The conditional expression won’t take effect otherwise!
Try debugging the program again and you’ll find it runs to completion without stopping. That’s because when execution reached line 23, the condition wasn’t true!
Trigger points
You can set breakpoints that don’t take effect until another breakpoint is encountered first. That “other breakpoint” is called a Trigger point, and can be set in the breakpoint properties (see the illustration above). Let’s give this a try.
Right-click on the breakpoint in the Breakpoints view to bring up the properties window, and check Trigger point. Leave the condition in place for now, and click Apply and Close.
Next, double-click in the margin next to line 29 to set a breakpoint there. Debug the program and notice that it doesn’t stop, even at line 29. This is because the breakpoint there isn’t triggered until the breakpoint at line 23 takes effect.
Now change the breakpoint properties at line 23 by clearing the Conditional box, click Apply and Close, and try debugging again. This time, because the breakpoint is no longer conditional, execution pauses at line 23.
Press F8 and execution pauses at line 29 as well! The breakpoint there has been triggered by the pause at line 23.
And that’s all we have to say for now about the Debugger. You can use the Window/Perspective/Open perspective menu to return to the Java perspective.
Continue to Elements of a Java Class.
